An analytical engine that compares forest loss inside protected areas against nearby unprotected counterfactuals using Google Earth Engine and QGIS.
29 Apr – 14 Aug 2026Development period
Generated Reports
Each report is a 2-page PDF. Page 1 is a full-page satellite map with a locator,
facts overlay, and legend. Page 2 has the forest-loss chart, key results, and a
narrative interpretation. The first batch of 18 priority sites has been processed through the full asset chain, producing 2-page PDF reports with satellite maps,
forest-loss charts, and key results:
Loads ~18,000 PA boundaries from the WDPA GeoDatabase; filters non-forest categories and marine-only sites
✓ Done
Counterfactual generation
Creates a 40 km buffer zone around each PA; clips out ocean, inland lakes, and overlapping PAs
✓ Done
Forest-loss comparison
Queries 25 years of GFW satellite imagery (2001–2025) inside vs. outside each PA
✓ Done
Effectiveness scoring
Computes the treatment effect: difference in forest-loss rates between PA and counterfactual
✓ Done
Satellite-imagery generation
Pulls Sentinel-2 basemap rasters and Meta canopy-height validation data for each PA
✓ Done
PDF report generation
QGIS layout composer renders 2-page per-PA reports with full-page satellite map, chart, and key results
✓ Done
The pipeline can process all ~18,000 sites in the World Database on Protected Areas
(WDPA), with ~275 priority sites flagged for immediate reporting and 18 already done.
Inputs: WDPA GeoDatabase (~18,000 PA boundaries), a priority-site filter list, Earth Engine datasets (Global Forest Watch forest-loss, Sentinel-2 imagery, Meta canopy height), GSHHG coastline data, and Natural Earth basemap.
Outputs: Per-PA 2-page PDF report with satellite map, forest-loss chart, key
results, and narrative text; GeoPackage boundary and counterfactual files;
forest-loss density rasters; and a CSV with per-PA forest-loss metrics.
The Orchestrator
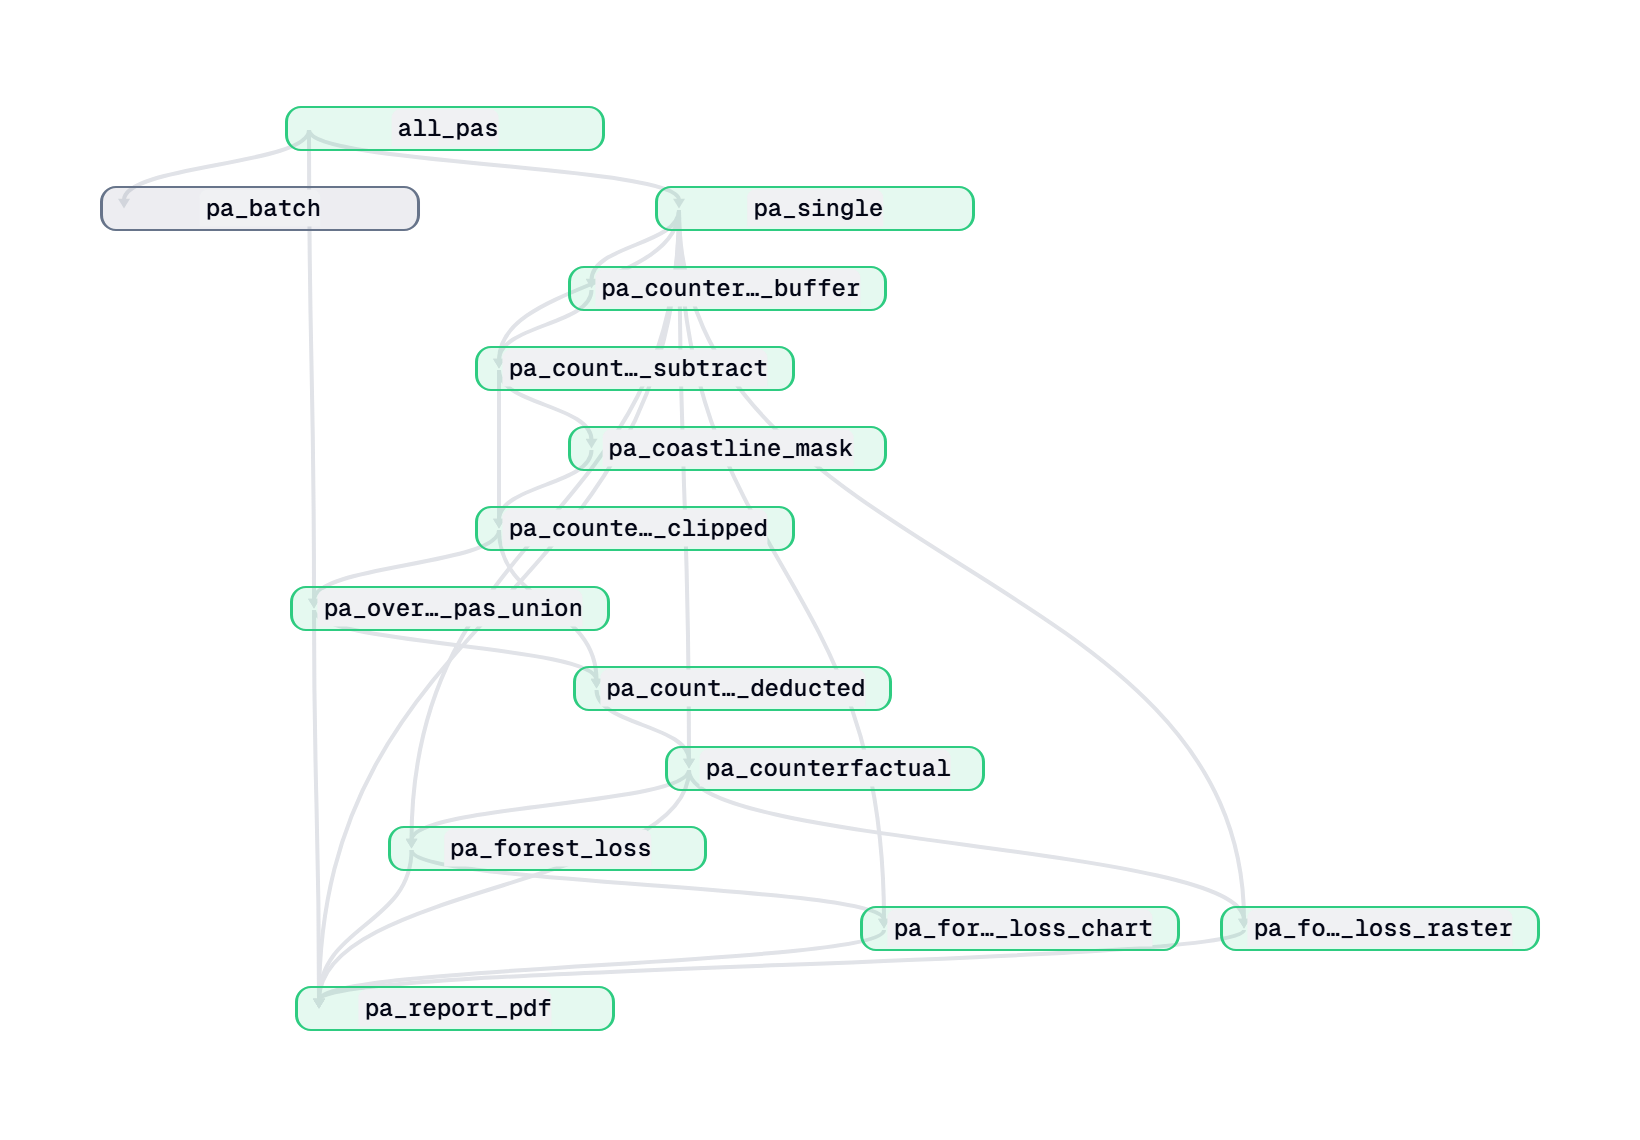
Pipeline Diagram
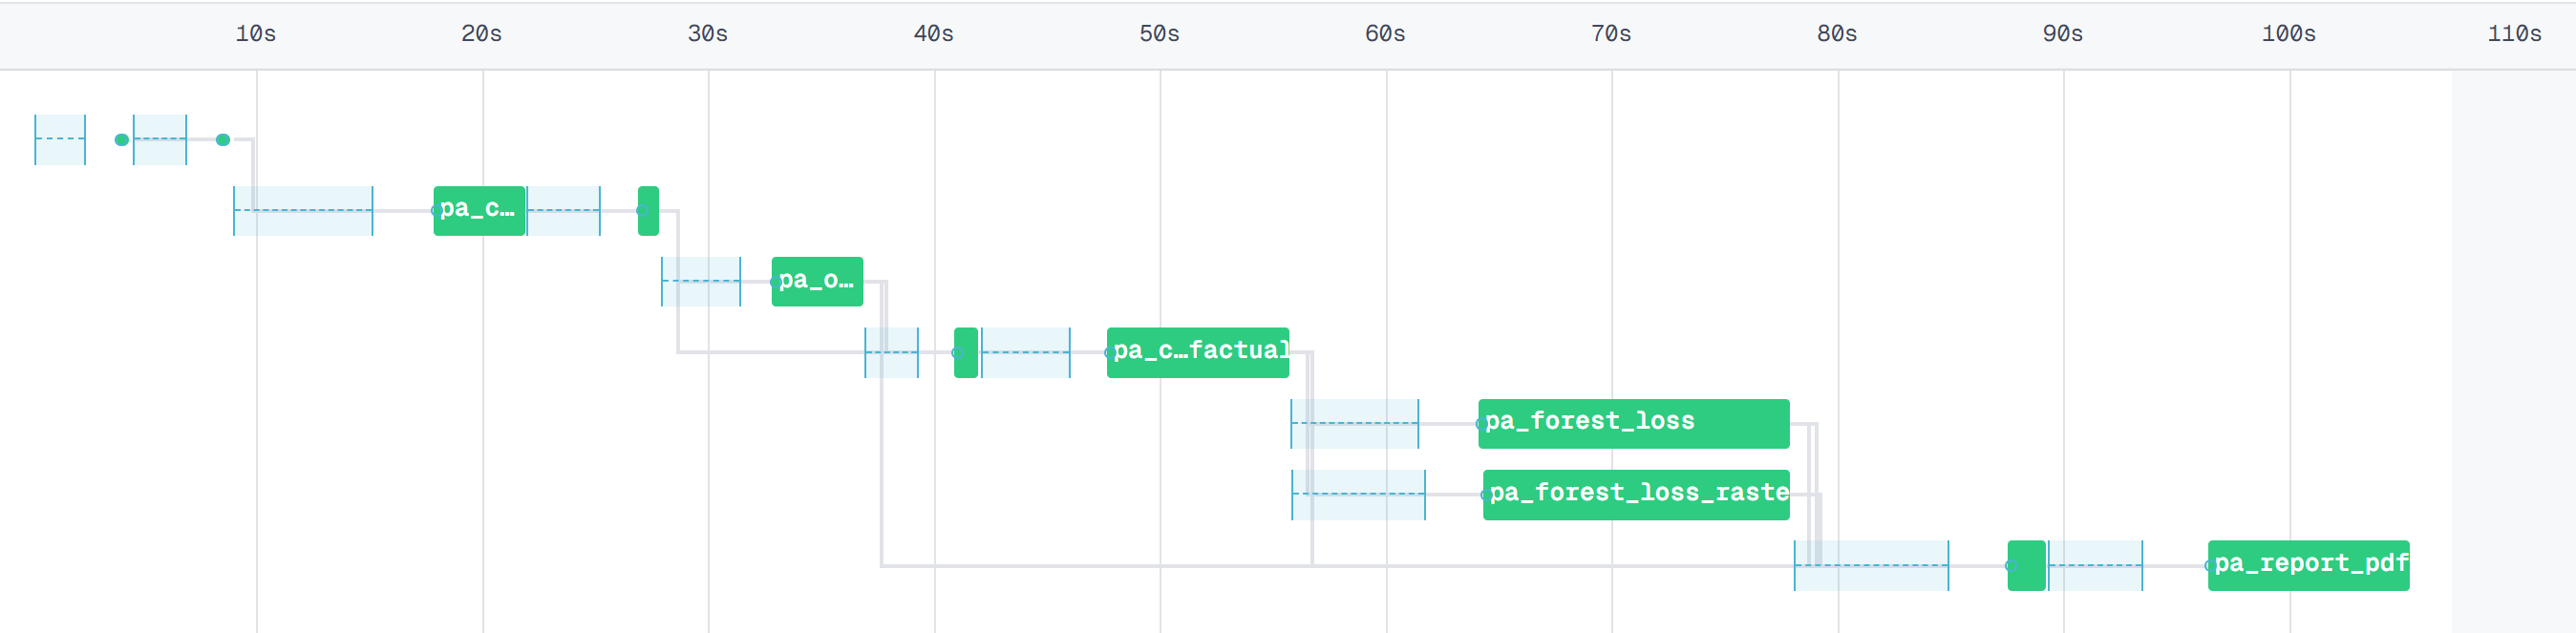
The pipeline was migrated from a single-shot CLI tool to a Dagster asset graph.
This achieves:
Parallel execution — multiple PAs processed concurrently, no sequential bottleneck
Per-site fault tolerance — if one PA fails (e.g., Earth Engine timeout), the rest continue unaffected
Web monitoring dashboard — live run status, logs, and output inspection in browser
Smart batching — PAs partitioned by UN M49 sub-region plus a priority batch; an automatic sensor fans batch results into individual per-PA jobs
Dagster asset graph with batched processing for ~18k PAs, GeoPackage I/O, basemap generator, counterfactual sub-assets, test coverage
3. Reporting & QGIS Composer
Jul 8 – Aug 2
31
Per-site CLI, EE connection manager, automated PDF reports, QGIS layout composer (multi-page with legends/scalebars/compass), cross-platform support, codebase formatting & docs
4. Production Hardening
Aug 3 – Aug 13
38.75
Cartographic refinement, module restructuring, shapefile/GDB tooling, UN M49 region partitioning, pdfy 0.2.0 upgrade, static analysis cleanup, timeline and report website
Total
113.75
Invoice
Period: 29 April 2026 — 13 August 2026
Total Effort:113.75 hours
Hourly Rate:$100.00 · Total Billed: $11,375.00 ·
PayPal: tanimoti@proton.me
Month
Hours
Sessions
Billing
April 2026
1.75
4
$175.00
May 2026
24
21
$2,400.00
June 2026
14
22
$1,400.00
July 2026
29.5
37
$2,950.00
August 2026
44.5
34
$4,450.00
Total
113.75
118
$11,375.00
Full Timeline of Work
Phase 1: Scoping & Core Pipeline (April–May)
We started by auditing the existing codebase and building out the core analysis chain: buffer zones, coastline clipping, forest-loss extraction, and per-PA reporting through a legacy CLI and HTML→PDF templates.
Week of 27 April 2026 · 4.25h
Date
Time
Hrs
Session
Wed 29 Apr
10:00 AM – 10:30 AM
0.5
Set up the development environment and reviewed the existing forest-loss codebase.
Wed 29 Apr
12:00 PM – 12:30 PM
0.5
Audited the tooling and sketched out unit tests for the main analysis steps: coastline clipping, buffers, forest-loss extraction.
Wed 29 Apr
2:15 PM – 2:45 PM
0.5
Reviewed how counterfactual buffers and inside-vs-outside comparison work. Excluded large geodata files from version control.
Wed 29 Apr
4:45 PM – 5:00 PM
0.25
Verified the previous session’s work completed successfully.
Fri 1 May
10:15 AM – 12:45 PM
2.5
Prototyped preprocessing scripts and wrote the repository context files.
Week of 4 May 2026 · 2.5h
Date
Time
Hrs
Session
Mon 4 May
2:00 PM – 2:15 PM
0.25
Tue 5 May
10:45 AM – 11:00 AM
0.25
Wed 6 May
1:45 PM – 3:30 PM
1.75
Built a buffer-zone cache for reuse across runs. Added the priority-site filter and completed the forest-loss CSV output with treatment-effect figures.
Wed 6 May
4:45 PM – 5:00 PM
0.25
Validated buffers against canopy-height data for fair PA vs. non-PA comparisons.
Week of 11 May 2026 · 0.5h
Date
Time
Hrs
Session
Tue 12 May
10:15 AM – 10:45 AM
0.5
Built visualizations of which PAs reduce loss relative to their surroundings.
Week of 18 May 2026 · 2h
Date
Time
Hrs
Session
Thu 21 May
3:00 PM – 3:15 PM
0.25
Investigated type-check warnings in the geodata indexing code.
Thu 21 May
4:30 PM – 6:15 PM
1.75
Annotated the analysis code with types. Validated the site IDs and built a CSV→YAML converter for data-integrity checks.
The work accelerated from here. We integrated coastline clipping so buffer zones exclude ocean and inland water, built out the PDF report template, and ran a real-site analysis on Las Baulas de Guanacaste (Costa Rica). The week ended with the first Dagster prototype, the point where we retired the old 7-step CLI in favor of an orchestrated asset graph.
Week of 25 May 2026 · 16.5h
Date
Time
Hrs
Session
Mon 25 May
12:45 PM – 5:15 PM
4.5
Built coastline clipping (buffers exclude ocean and lakes). Wrote integration tests for the full buffer-clip-loss pipeline. Refined PDF template styling.
Mon 25 May
8:00 PM – 8:30 PM
0.5
Verified PDF template styling adjustments.
Mon 25 May
10:30 PM – 10:45 PM
0.25
Identified a page-header sizing bug in the template.
Tue 26 May
12:30 AM – 5:15 AM
4.75
Extensive PDF template work: modularized the Jinja2 templates, refined borders/spacing, parameterized the build scripts, and reviewed outputs.
Tue 26 May
1:00 PM – 1:15 PM
0.25
Checked template output against the reference docs.
Tue 26 May
4:00 PM – 4:15 PM
0.25
Reorganized inline CSS into structured blocks.
Wed 27 May
5:30 AM – 5:45 AM
0.25
Explored visual options for the report layout.
Wed 27 May
10:30 AM – 10:45 AM
0.25
Refined template parameter naming.
Wed 27 May
2:00 PM – 2:15 PM
0.25
Standardized the design-token variable names.
Wed 27 May
4:00 PM – 7:30 PM
3.5
Ran the real analysis on Las Baulas de Guanacaste (Costa Rica). Tuned buffers after marine clipping, diagnosed coordinate-system warnings, and added satellite imagery for the maps.
Thu 28 May
2:00 PM – 2:15 PM
0.25
Reviewed EE forest-loss architecture, comparing JS and Python approaches to tree-cover change.
Fri 29 May
1:00 PM – 1:15 PM
0.25
Researched rerunnable pipeline design for large-scale analysis.
Fri 29 May
2:45 PM – 4:00 PM
1.25
Built a first Dagster prototype with a web UI to orchestrate the geospatial assets.
Phase 2: Dagster Retrofit (June)
We retrofitted the pipeline into a Dagster asset graph with batched processing for ~18,000 protected areas, dynamic partitions, and a sensor-driven architecture. We also built the supporting components: GeoPackage persistence, a Natural Earth basemap generator, and QGIS tooling.
Week of 1 June 2026 · 1.25h
Date
Time
Hrs
Session
Mon 1 Jun
2:45 PM – 3:00 PM
0.25
Continued Dagster development, tested web UI execution of the geospatial assets.
Mon 1 Jun
4:45 PM – 5:00 PM
0.25
Fixed dependency installation issues in the development environment.
Tue 2 Jun
11:45 AM – 12:00 PM
0.25
Integrated TDD into the Dagster prototype.
Thu 4 Jun
4:30 PM – 4:45 PM
0.25
Moved the PA loader from flat CSVs to the full GeoDatabase. Cleaned up the documentation.
Thu 4 Jun
5:45 PM – 6:00 PM
0.25
Started turning the analysis steps into Dagster assets with consistent naming.
Week of 8 June 2026 · 0.5h
Date
Time
Hrs
Session
Thu 11 Jun
4:00 PM – 4:30 PM
0.5
Reviewed the test suite to assess pipeline status and clarified assets vs. jobs in Dagster.
Week of 15 June 2026 · 2.25h
Date
Time
Hrs
Session
Mon 15 Jun
12:45 PM – 1:15 PM
0.5
Debugged Dagster CLI issues while setting up orchestration.
Mon 15 Jun
3:00 PM – 3:15 PM
0.25
Fixed import errors that prevented Dagster from discovering the asset definitions.
Tue 16 Jun
11:30 AM – 11:45 AM
0.25
Reviewed the coastline manager that clips ocean and lakes from the buffers.
Wed 17 Jun
8:00 PM – 8:15 PM
0.25
Reviewed GFW forest-loss logic and how it counts deforestation within PAs.
Thu 18 Jun
3:30 PM – 3:45 PM
0.25
Added timeouts to the long-running geospatial tests.
Thu 18 Jun
5:00 PM – 5:45 PM
0.75
Consolidated test fixtures and fixed a venv cleanup issue on Windows.
Week of 22 June 2026 · 6.75h
Date
Time
Hrs
Session
Mon 22 Jun
2:15 PM – 3:15 PM
1
Set up the environment for extracting PA boundaries from the WDPA GeoDatabase.
Mon 22 Jun
5:00 PM – 5:30 PM
0.5
Compared data formats for merging PA boundaries from several sources.
Tue 23 Jun
1:30 PM – 4:00 PM
2.5
Retrofitted the pipeline onto Dagster with batched processing to handle ~18,000 PAs.
Tue 23 Jun
8:15 PM – 9:00 PM
0.75
Reworked the asset graph for batched processing.
Wed 24 Jun
12:30 PM – 12:45 PM
0.25
Selected Guanacaste PAs (Costa Rica) as representative test cases.
Fri 26 Jun
3:00 PM – 4:30 PM
1.5
Organized the assets and built the sensor + batch partitioning for parallel runs across 18k sites.
Sat 27 Jun
5:30 PM – 5:45 PM
0.25
Reviewed the GFC methodology to ensure correct interpretation of the loss metrics.
With the Dagster retrofit in place, we turned to the data layer: a GeoPackage I/O manager for persisting geometries between assets, a Natural Earth basemap generator for report maps, and splitting the counterfactual sub-pipeline into discrete sub-assets (buffer, subtract, coastline clip, overlapping-PA deduct).
Week of 29 June 2026 · 7.5h
Date
Time
Hrs
Session
Mon 29 Jun
1:45 PM – 2:00 PM
0.25
Built the GeoPackage persistence for passing geometries between steps.
Mon 29 Jun
4:00 PM – 5:00 PM
1
Built the Natural Earth basemap generator and fixed type-check issues in the tests.
Tue 30 Jun
4:30 PM – 6:30 PM
2
Finished the basemap script and inspected several PA boundaries in QGIS.
Wed 1 Jul
1:45 PM – 2:15 PM
0.5
Built a QGIS launcher script and fixed a failing test in single-PA extraction.
Wed 1 Jul
3:45 PM – 4:30 PM
0.75
Built the counterfactual buffer sub-pipeline; split it into sub-assets and fixed coastline-clipping problems.
Wed 1 Jul
7:45 PM – 8:15 PM
0.5
Fixed a deduplication issue in the counterfactual subtraction for overlapping PAs.
Thu 2 Jul
3:30 PM – 6:00 PM
2.5
Reviewed test coverage and identified which legacy features still needed porting to Dagster.
The pipeline now produced per-PA forest-loss metrics, so the next phase was the end product: automated 2-page PDF reports with satellite maps, charts, and narrative text, rendered through a QGIS layout composer. In parallel we added a per-site CLI and an Earth Engine connection manager, and started planning deployment.
Week of 6 July 2026 · 1.75h
Date
Time
Hrs
Session
Wed 8 Jul
3:15 PM – 3:30 PM
0.25
Drafted a project summary explaining the method and architecture for non-technical readers.
Thu 9 Jul
5:30 PM – 6:00 PM
0.5
Started a per-year loss breakdown; looked at deployment options.
Fri 10 Jul
4:45 PM – 5:45 PM
1
Continued the year-by-year breakdown; studied deployment templates.
Week of 13 July 2026 · 10.5h
Date
Time
Hrs
Session
Mon 13 Jul
2:45 PM – 4:00 PM
1.25
Fixed spatial data-type conflicts and standardized path building across the pipeline.
Mon 13 Jul
5:30 PM – 5:45 PM
0.25
Built CLI tooling to run a full analysis on one PA by name.
Mon 13 Jul
7:15 PM – 7:30 PM
0.25
Verified forest-loss measurement units and computation methodology.
Mon 13 Jul
10:15 PM – 10:30 PM
0.25
Finalized the per-site config for running the full pipeline on one site.
Tue 14 Jul
1:00 PM – 2:30 PM
1.5
Configured the Dagster scheduler and set input defaults for scale.
Tue 14 Jul
4:30 PM – 5:30 PM
1
Started the automated PDF generator, charts plus satellite maps into a conservation profile.
Tue 14 Jul
6:45 PM – 9:45 PM
3
Analysed the counterfactual method and reviewed reference PDFs to determine the layout standard.
Wed 15 Jul
1:15 PM – 1:30 PM
0.25
Traced the data flow from raw rasters to the finished report page.
Fri 17 Jul
1:15 PM – 4:00 PM
2.75
Reorganized the output directory structure; built a unified EE connection manager; made chart styling configurable per site.
Week of 20 July 2026 · 2.25h
Date
Time
Hrs
Session
Mon 20 Jul
2:00 PM – 2:45 PM
0.75
Completed the end-to-end pipeline: Dagster now produces a draft PDF per PA.
Tue 21 Jul
3:00 AM – 3:15 AM
0.25
Set up a secure remote mirror for collaboration.
Tue 21 Jul
4:45 PM – 5:00 PM
0.25
Estimated compute needs for running thousands of sites.
Tue 21 Jul
8:15 PM – 8:30 PM
0.25
Added shapefile loading for priority lists and fixed background-process cleanup in the development startup script.
Tue 21 Jul
10:00 PM – 10:15 PM
0.25
Adjusted report templates for the priority profiles going out for review.
Wed 22 Jul
5:15 PM – 5:30 PM
0.25
Exposed the Dagster dashboard on the network; built a shapefile→GeoPackage converter.
Thu 23 Jul
5:00 PM – 5:15 PM
0.25
Up to this point, PDFs were generated through an HTML→PDF path using Playwright/Chromium. The output quality was insufficient, so we replaced it with a QGIS layout composer for proper cartographic output, featuring multi-page layouts with aligned map elements, legends, scale bars, compasses, and satellite imagery, and achieved cross-platform operation (Windows/Linux).
Week of 27 July 2026 · 16.5h
Date
Time
Hrs
Session
Mon 27 Jul
4:00 PM – 4:15 PM
0.25
Put the codebase under version control.
Mon 27 Jul
11:15 PM – 11:45 PM
0.5
Cloned and initialized the repository.
Tue 28 Jul
12:00 AM – 12:30 AM
0.5
Set up collaborative workflow.
Tue 28 Jul
2:45 AM – 4:00 AM
1.25
Set up the Python environment and ran the tests against GFW data.
Tue 28 Jul
4:00 PM – 7:00 PM
3
Ran the tests and started on the PDF report layout.
Tue 28 Jul
9:15 PM – 9:30 PM
0.25
Reviewed the survey tests and WDPA column mappings.
Wed 29 Jul
3:15 PM – 3:45 PM
0.5
Refined the PDF layouts for inside-vs-outside loss.
Wed 29 Jul
4:45 PM – 5:30 PM
0.75
Fixed a mocked-imagery bug in the tests and split the asset code into modules.
Wed 29 Jul
6:45 PM – 7:00 PM
0.25
Added forest-loss density raster export (pixel-level loss imagery).
Wed 29 Jul
11:15 PM – 11:30 PM
0.25
Moved map rendering to QGIS composer for higher-resolution output.
Thu 30 Jul
1:15 AM – 2:15 AM
1
Built PDF V5 (full-page map, enhanced charts); fixed GDAL dependency issues.
Thu 30 Jul
5:45 PM – 7:00 PM
1.25
Achieved Linux compatibility for the rendering pipeline (excluding headless QGIS).
Thu 30 Jul
8:30 PM – 8:45 PM
0.25
Refactored the composer script into reusable drawing functions.
Fri 31 Jul
11:00 PM – 11:45 PM
0.75
Calibrated line weights so boundaries, buffers, and coastlines read clearly.
Sat 1 Aug
12:00 AM – 12:15 AM
0.25
Reviewed the template for special characters that break label rendering.
Sat 1 Aug
10:15 PM – 10:30 PM
0.25
Finished PDF V6, multi-page reports with legends and scale bars.
Formatted the whole codebase and wrote the repository documentation (EE workflow, WDPA paths, QGIS).
Phase 4: Production Hardening (August – ongoing)
Production hardening began in August: code quality, cartographic refinement, module restructuring, and tooling for downstream analysis. We refactored PDF generation so the QGIS composer renders directly (no more intermediate HTML→PDF step), and re-keyed the partition system by UN M49 sub-region for geographic batch processing. This phase is ongoing — substantial work remains, including the 300+ remaining priority reports, text content, and symbology.
Week of 3 August 2026 · 17h
Date
Time
Hrs
Session
Mon 3 Aug
5:15 PM – 6:15 PM
1
Standardized formatting, replaced bare excepts with specific types, upgraded pdfy to .2.0.
Tue 4 Aug
3:00 AM – 5:00 AM
2
Recovered some lost improvements and reconciled the lint config.
Tue 4 Aug
6:00 AM – 6:45 AM
0.75
Fixed a missing Linux audio lib blocking headless PDF generation.
Tue 4 Aug
6:30 PM – 8:45 PM
2.25
Full Linux compatibility now; debugged QGIS satellite loading cross-platform.
Wed 5 Aug
2:45 AM – 4:00 AM
1.25
Improved rendering with reverse order; added PA labels with leader lines.
Wed 5 Aug
5:45 AM – 6:00 AM
0.25
Resolved remaining static-analysis issues.
Wed 5 Aug
11:00 AM – 2:45 PM
3.75
Big cartography pass: greyed out non-target PAs, tuned the scalebar, geometry-accurate loss raster cropping.
Thu 6 Aug
4:30 PM – 5:45 PM
1.25
Wrote down the map-composition standards and aligned elements to cartographic conventions.
Fri 7 Aug
12:00 AM – 1:30 AM
1.5
Wrote down the map-composition standards and aligned elements to cartographic conventions.
Fri 7 Aug
3:30 AM – 5:15 AM
1.75
Finalized the lower-left legend (single-line labels, km scalebar, compass on white box).
Sat 8 Aug
11:15 AM – 11:45 AM
0.5
Refactored PDF generation so QGIS renders the 2 pages directly, removing the intermediate HTML step.
Sat 8 Aug
1:15 PM – 1:30 PM
0.25
Split the big asset module into grouped sub-modules.
Sun 9 Aug
7:30 PM – 7:45 PM
0.25
Renamed/cleaned the counterfactual geometry helpers.
Sun 9 Aug
8:45 PM – 9:00 PM
0.25
Extracted repeated map-element drawing into reusable functions.
Week of 10 August 2026 · 21.75h
Date
Time
Hrs
Session
Mon 10 Aug
1:00 PM – 1:15 PM
0.25
Continued refactoring the QGIS layout code.
Mon 10 Aug
2:45 PM – 3:15 PM
0.5
Folded satellite imagery generation into the main report asset.
Mon 10 Aug
5:15 PM – 7:00 PM
1.75
Re-enabled the chart and finalized PDF V7 (2 pages: map, chart, key results).
Mon 10 Aug
10:00 PM – 10:15 PM
0.25
Built a shapefile→CSV converter and started overlap analysis across PA datasets.
Tue 11 Aug
12:45 PM – 5:15 PM
4.5
Continued analysis of overlap patterns between designations.
Tue 11 Aug
6:45 PM – 7:15 PM
0.5
Fixed the shapefile/GDB converters; analysed PA attribute tables for overlaps and data quality.
Tue 11 Aug
8:15 PM – 8:30 PM
0.25
Built conversation-clustering utilities to analyze session logs against commits.
Wed 12 Aug
7:30 AM – 10:00 AM
2.5
Validated the geopackage contents used in the counterfactual analysis.
Wed 12 Aug
11:15 AM – 1:15 PM
2
Turned the exploration scripts into CLI tools; added auto-classification; switched partition keys to UN region.
Wed 12 Aug
3:15 PM – 6:00 PM
2.75
Built tiered PA CSVs; refined the session classification with the OpenRouter API and local YAML cache.
Wed 12 Aug
10:30 PM – 10:45 PM
0.25
Fixed the QGIS run scripts, anchored the facts box, restructured docs/timeline, deduplicated composer helpers, added the compass-rose SVG. Panned the map south to clear the legend, removed the threat boxes to enlarge the map. Built the first styled timeline draft.
Thu 13 Aug
12:30 AM – 1:15 AM
0.75
Added the HTML website for the timeline and linked the report PDFs.
Thu 13 Aug
10:45 AM – 11:45 AM
1
Refined facts-box alignment and page-2 chart centring.
Thu 13 Aug
1:30 PM – 2:45 PM
1.25
Padded the map extent for legend clearance, centred the page-2 chart, served reports beside the timeline site, added pipeline screenshots, rendered the timeline to PDF, fixed the report links, and split the markdown into structured inputs.
Thu 13 Aug
5:30 PM – 8:45 PM
3.25
Added the Inputs section and embedded diagrams; reordered content for flow; fixed the chart PNG export path.